


Color customization can be done on all types of charts in the Custom Dashboards following the steps below.
Note: This customization can only be done on charts in the Custom Dashboards, not the Built-in dashboards.
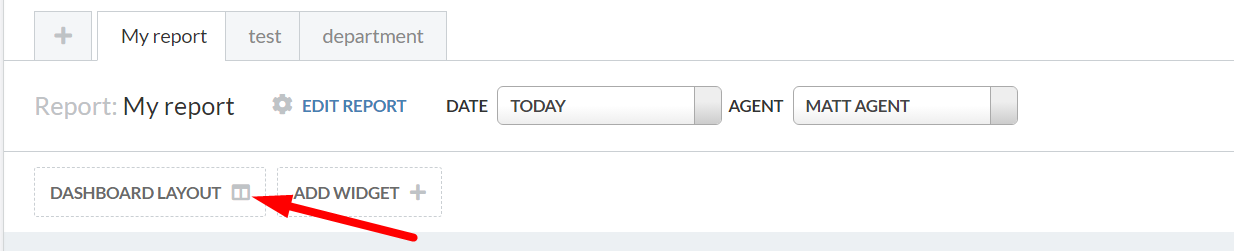
1. Select a Custom Dashboard.
2. Select Dashboard Layout
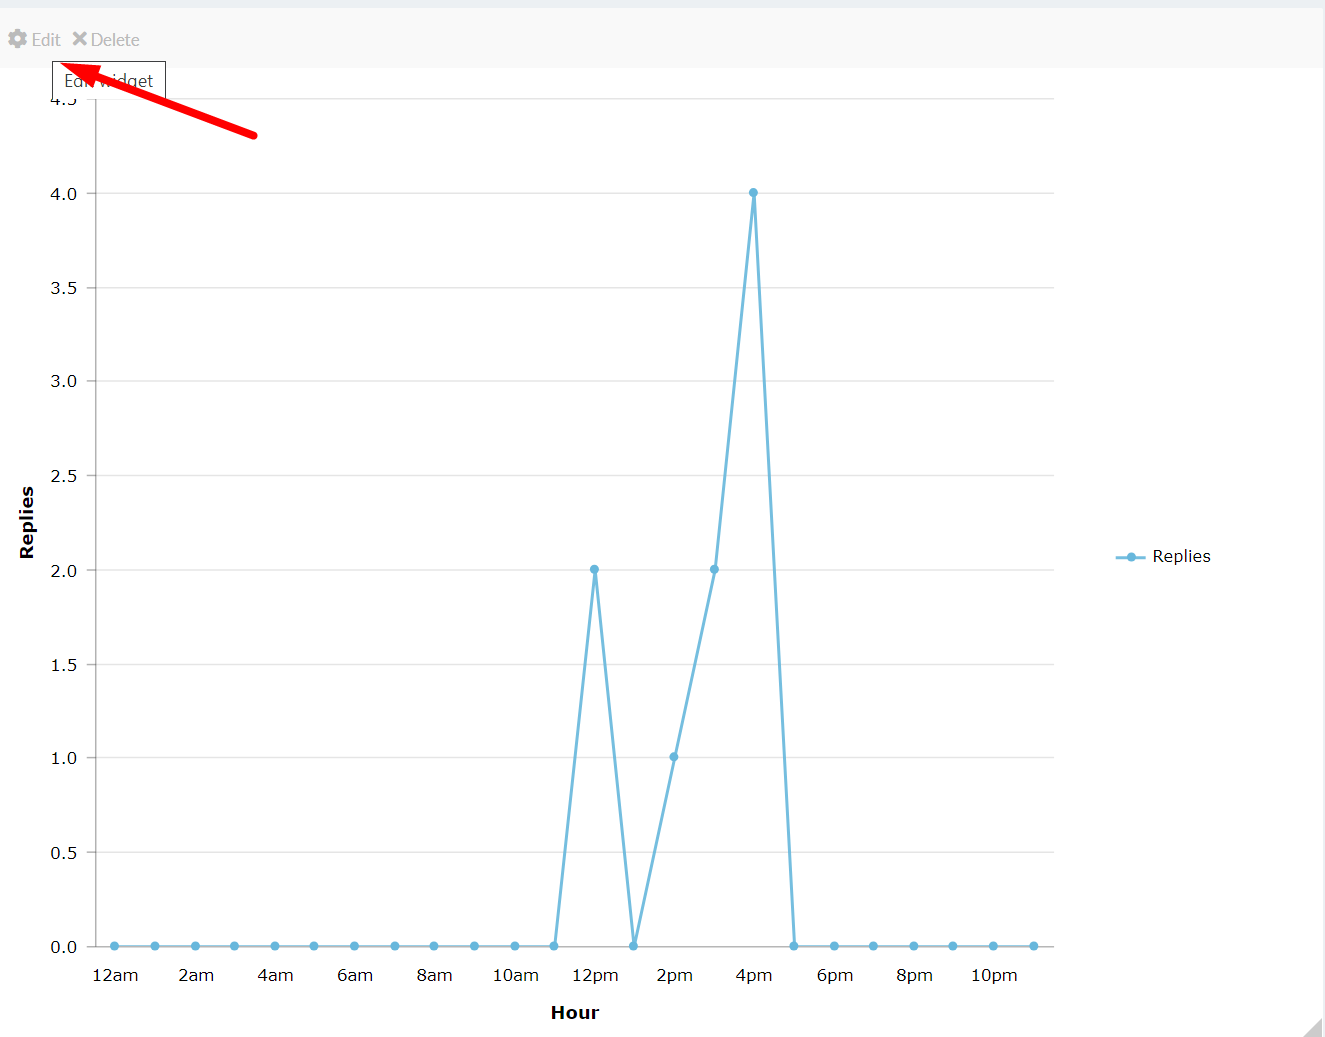
3. Hover over the title of your widget on the top left-hand corner and select 'Edit Widget'.
 4. A pop-up window will appear. Under Widget Options, you can put in the code for the color you would like to change to.
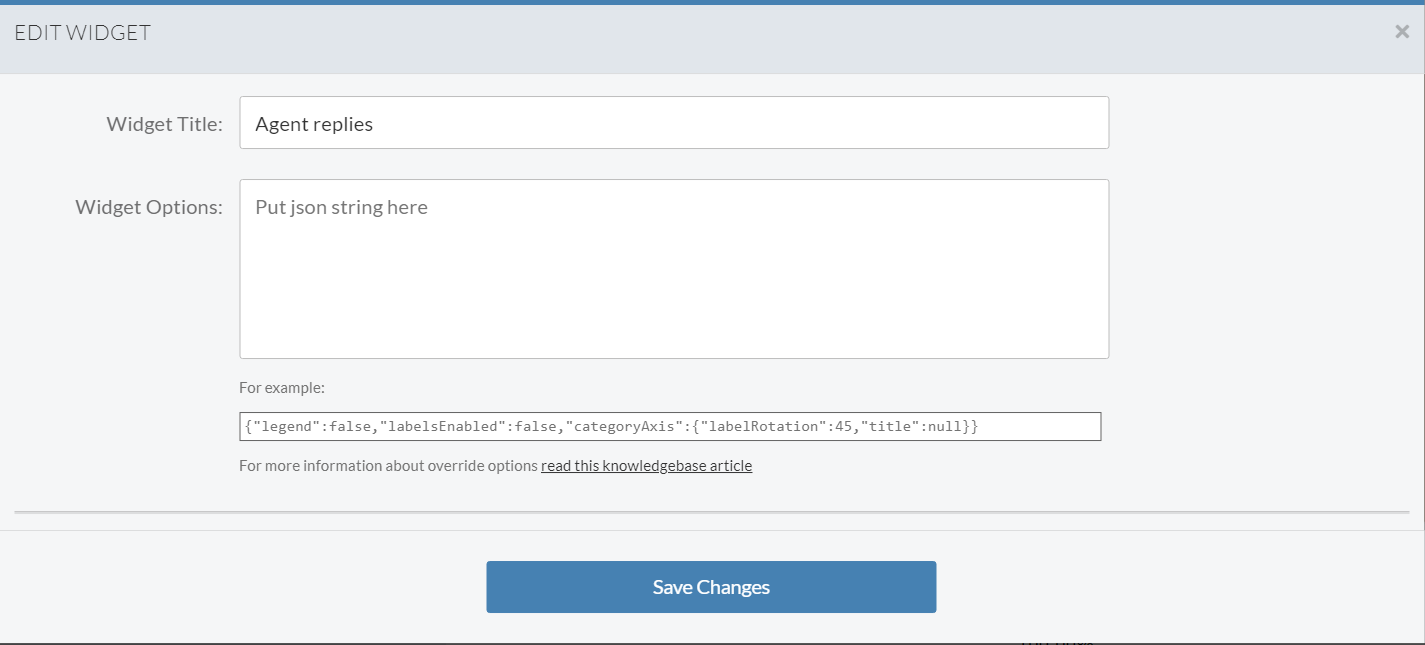
The format is written as:
{"colors":["#COLOURCODE"]}
The #COLOURCODE will be where you insert the hex color code. Each color is associated with a code. At the end of this article is a list of common color codes that are used.
In this example, to change the color from blue to orange, the code below would be entered:
{"colors":["#FF6600"]}
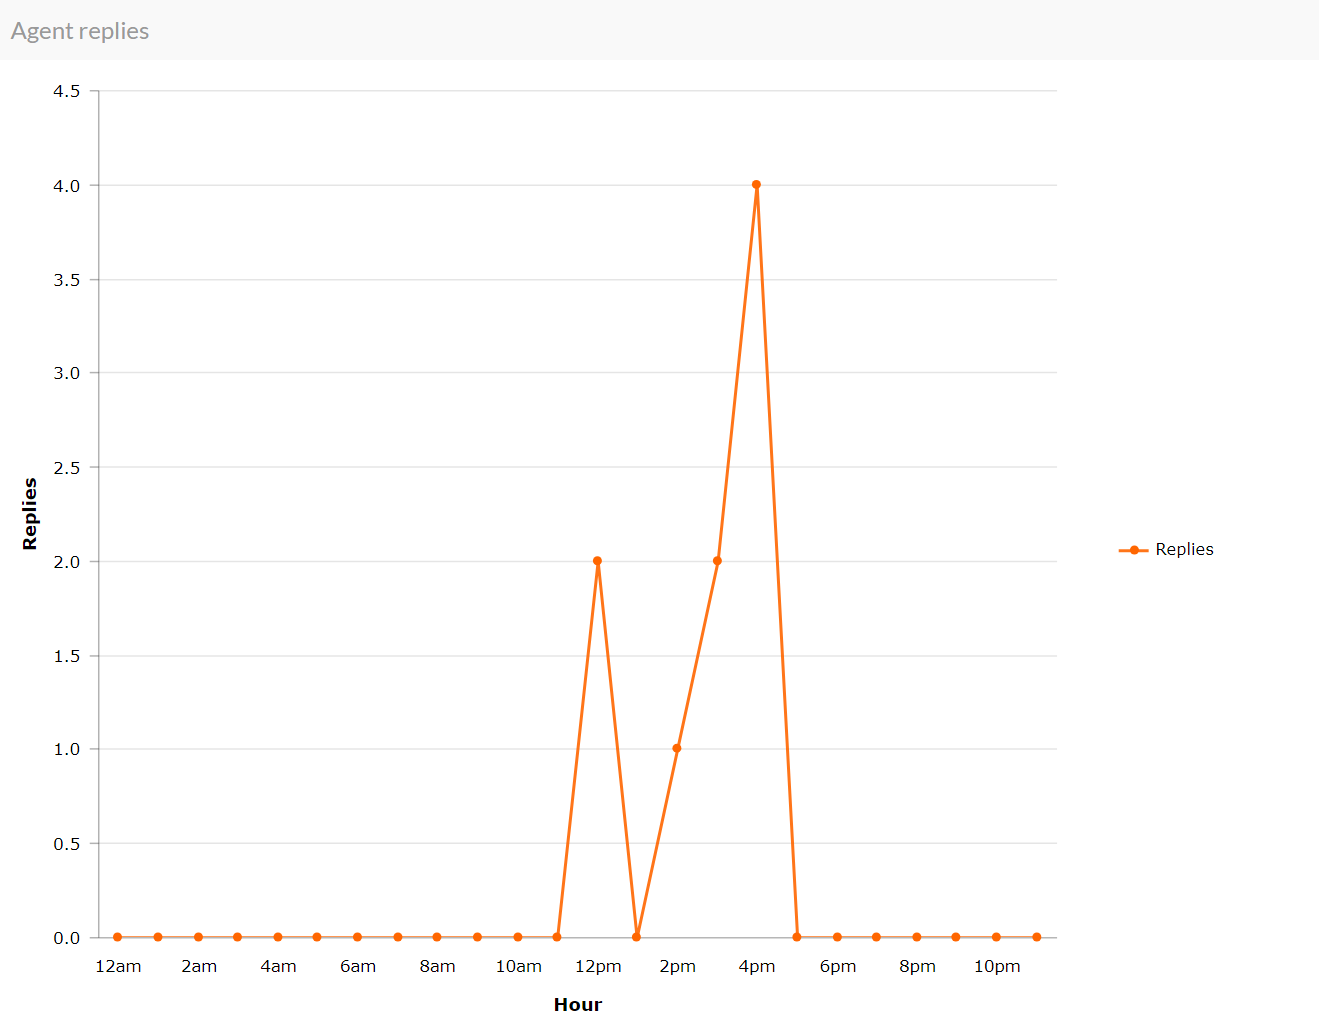
5. Click Save Changes. The graph will be automatically updated as shown:
 If you have more than one type of color you would like to change, here is an example of how to change it. In this example, we will change the color of the bar chart from blue and yellow to orange and green.

Repeat Steps 1 to 3 from above, in Step 4, the format below is used:
{"colors":["#COLOURCODE1", "#COLOURCODE2"]}
In this example, it will be written as:
{"colors":["#FF6600", "#008000 "]}
Click on Save Changes, and the result can be automatically seen on the Dashboard.

If there are more than two colors in the graph, the same format would be used, with a comma separating each color code.
Here is a list of color codes that could be useful to use:
Color | HTML code |
|---|---|
Red | #FF0000 |
Green | #008000 |
Blue | #0000FF |
Orange | #FF6600 |
Purple | #800080 |
Black | #000000 |
Gray | #808080 |