How to inspect AJAX requests with Chrome tools - Tietokanta / Deskpro Legacy - Deskpro Support

WARNING: You're browsing documentation for an older version of Deskpro. For the most up-to-date version, see: How to inspect AJAX requests in Chrome

How to inspect AJAX requests with Chrome tools

Authors list

The Deskpro interface uses a web programming technique called AJAX to allow the pages to update dynamically without the need to refresh the whole page.

Sometimes a Deskpro support agent may ask you to inspect individual AJAX requests to help diagnose a problem.

Here's how to do this:

1. Use the Chrome web browser.

2. Open the Deskpro interface where there's a problem.

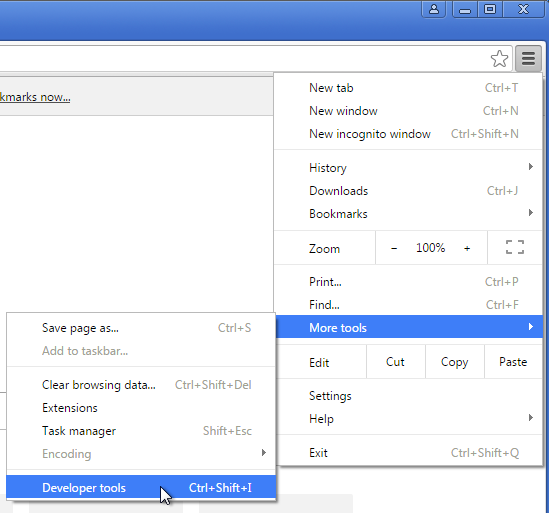
3. Within the Chrome menu system, select More tools > Developer tools.
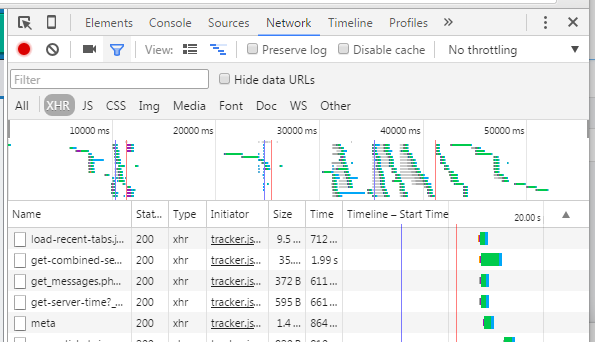
4. When the developer tools console opens, click on the Network tab, then click XHR below.

5. You can now see the AJAX requests. The Deskpro agent has probably told you some steps to take and a particular request to look for. Click on an individual request to see the request details, which you should copy and send to Deskpro.


Hyödyllinen Hyödytön

Henkilöt, jotka pitivät tätä sivua hyödyllisenä: 174 / 330

Comment (1)

Stephen Pienaar
These steps helped us troubleshoot an annoying and elusive problem. Studing the AJAX calls, we were able to confirm that the problem was somewhat random, and hence not something in our Apache or Mod Security configuration. The culprit was a flood protection setting in our firewall that limited the number of concurrent connections to port 443 -- DeskPRO needed more connections, especially immediately after logging in.

Lisää kommentti

Please log in or register to submit a comment.

Need a password reminder?