As part of product release Deskpro 2018.1, we’re delighted to announce a brand new update of the reporting interface within Deskpro.
What’s new with Reports?
The new Reports update consists of the following improvements:

DPQL v2
We have introduced several improvements to how DPQL works in Reports. You can find out all about them in this news post.
Dashboards
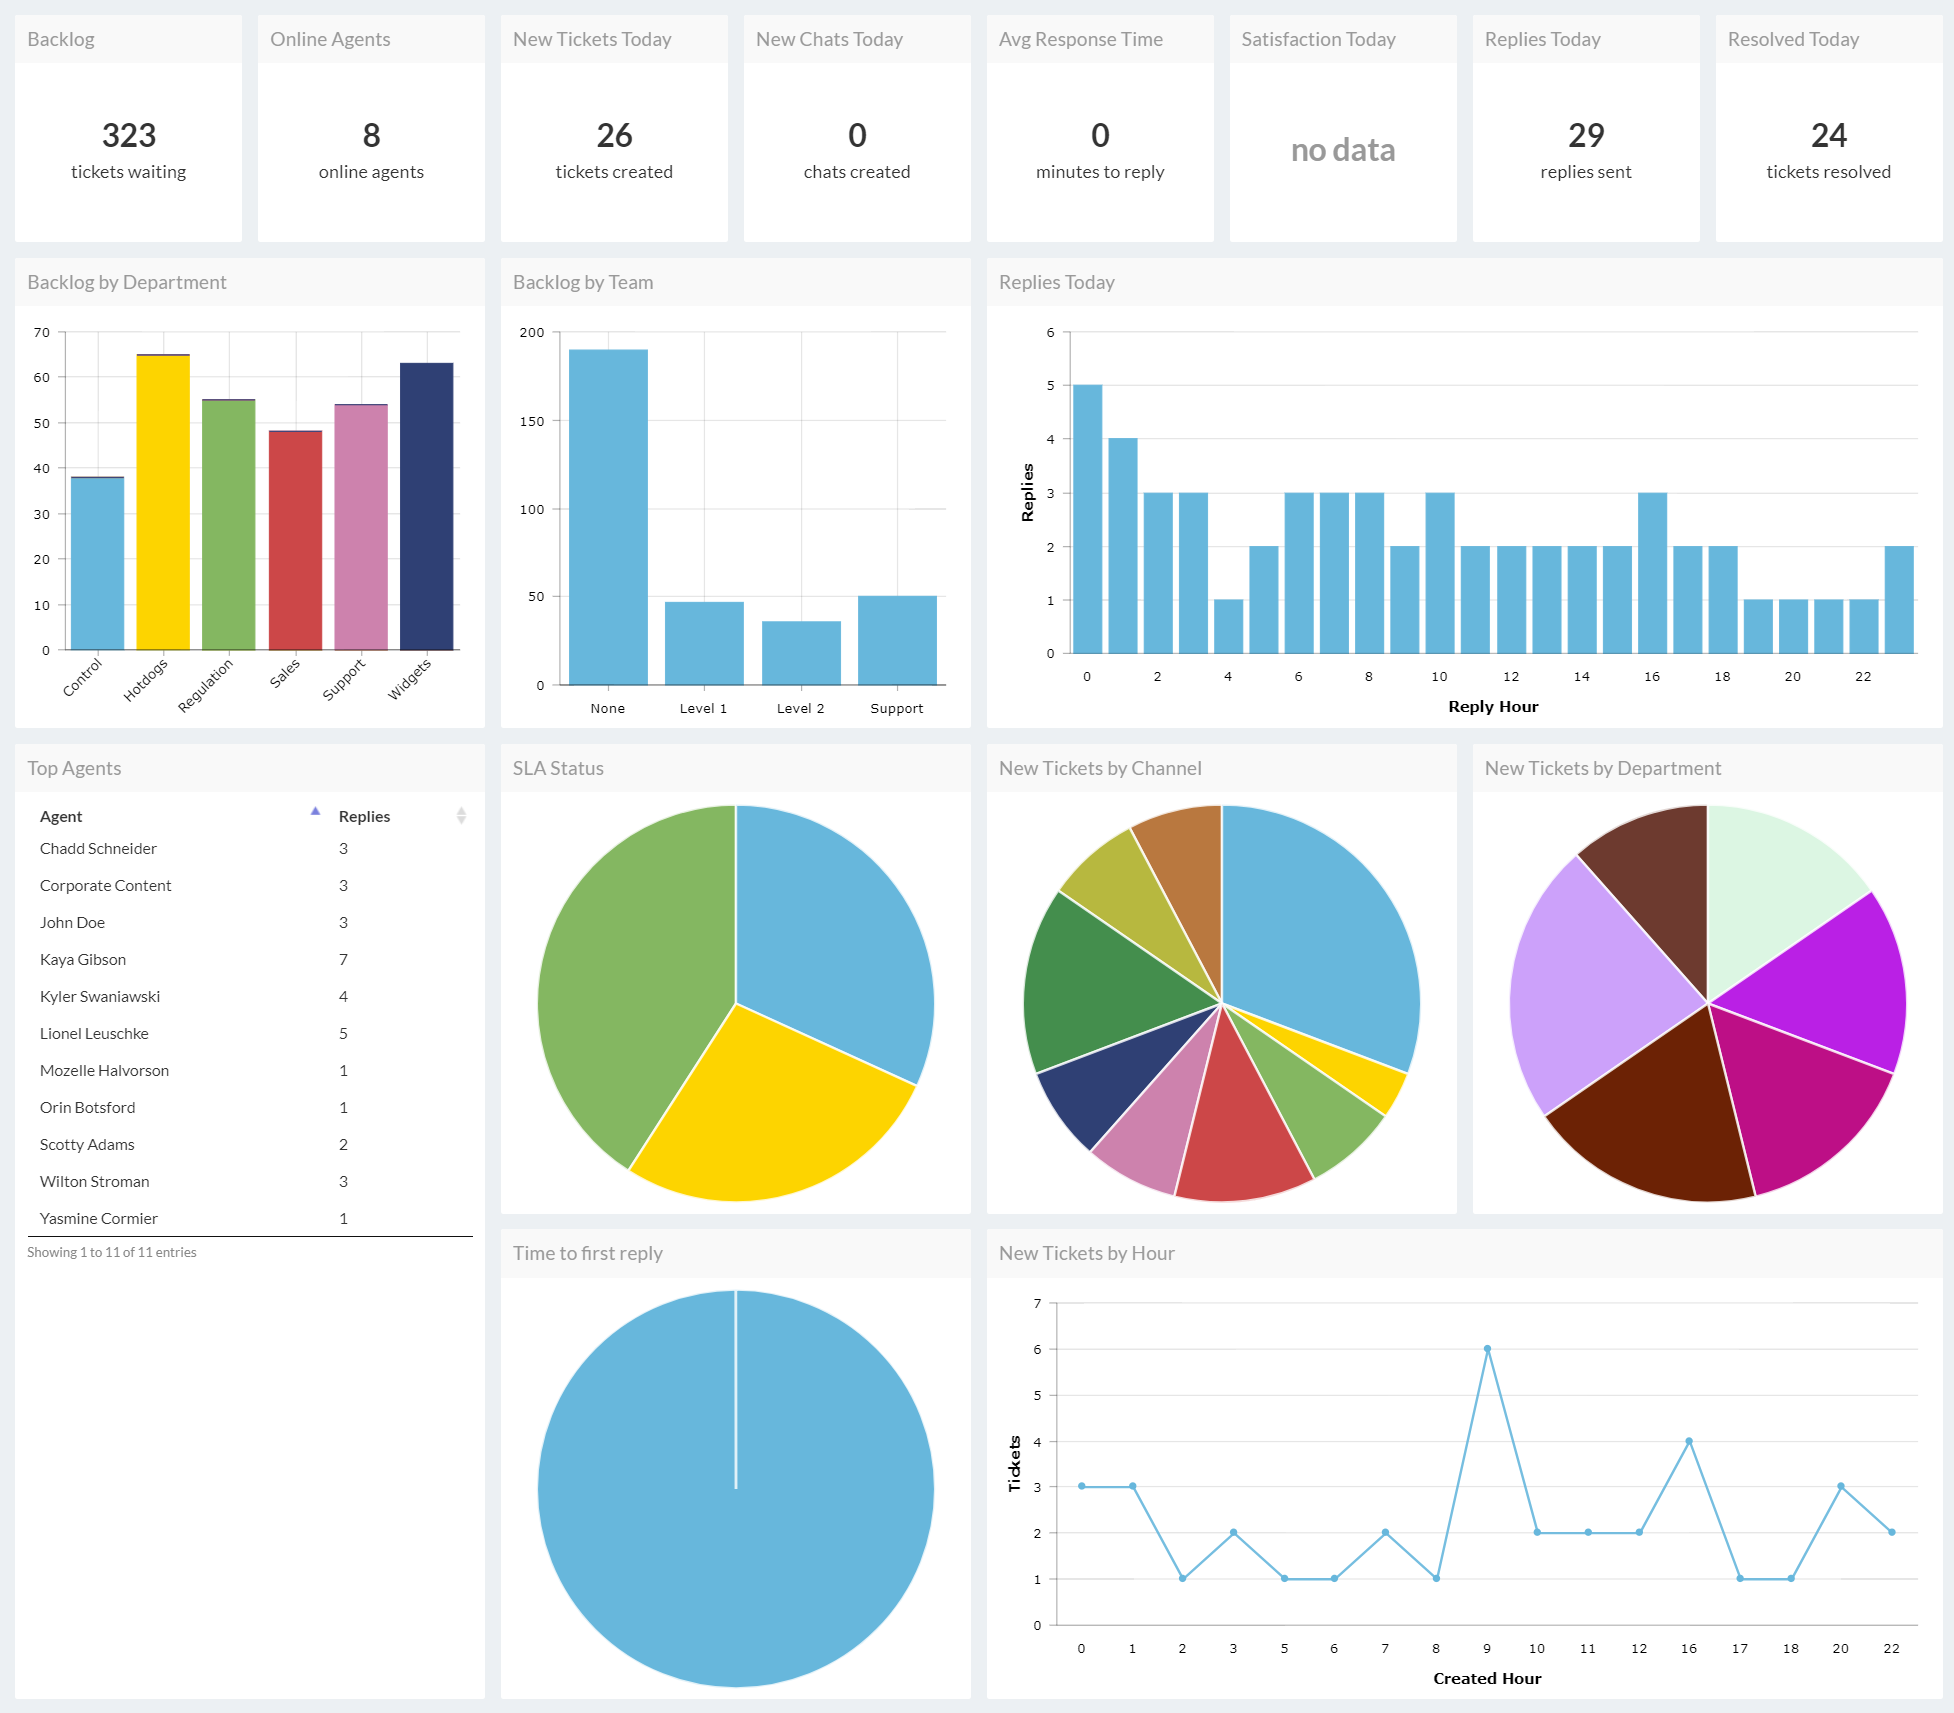
One of the biggest and most important changes to Reports is to how information is presented in the Overview, with the addition of dashboards.
Dashboards are predefined collections of individual reports.
Each dashboard contains one or more report, which appear as tabs at the top of the dashboard.
Each report contains a set of statistics that can be arranged in a diverse range of formats.
Dashboards can be easily shared amongst admins, teams, or specific agents.
Deskpro dashboards contain ‘top-level variables’ - variables which apply across all the stats that exist in the dashboard. Common top-level variables are date ranges, teams, or departments.
Dashboards are the perfect tool for viewing lots of critical helpdesk data or information at the same time, allowing you and your team to develop and share a comprehensive understanding of support performance.
Stat Builder
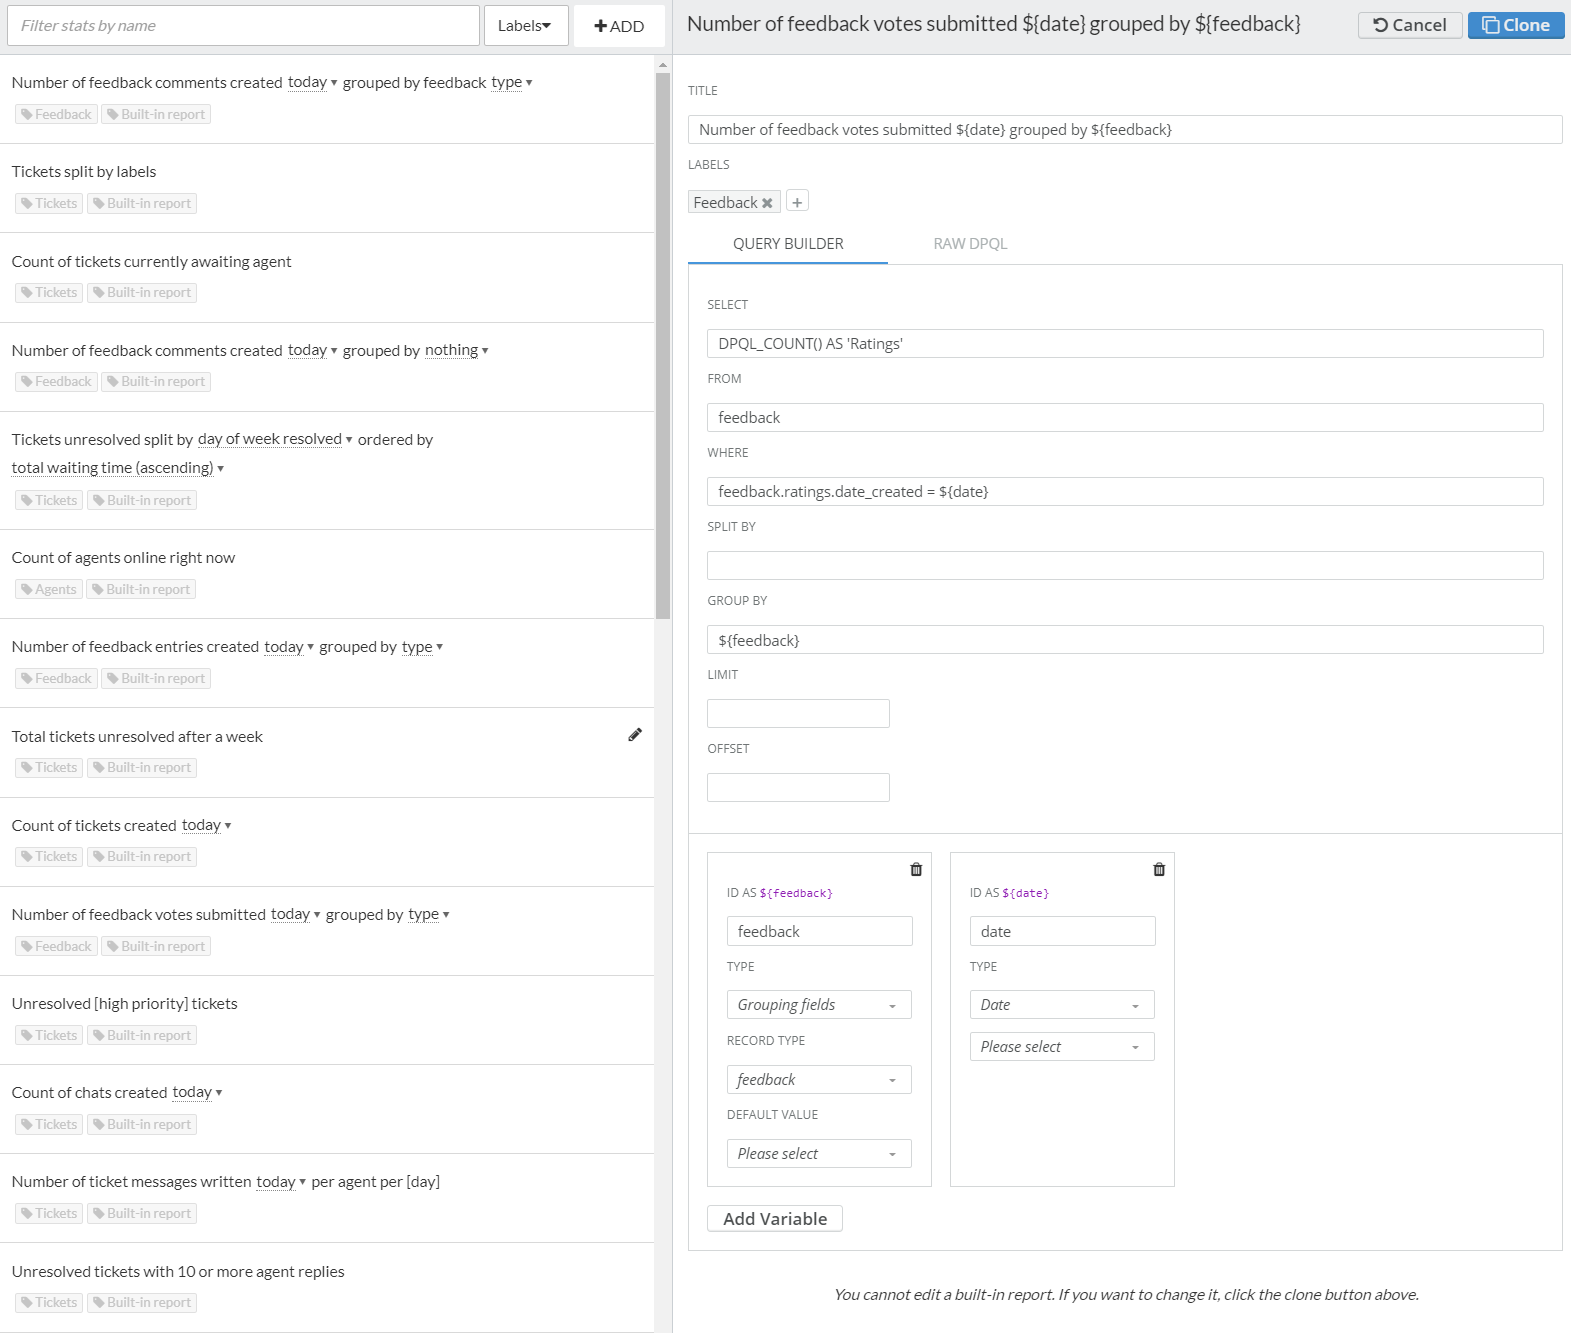
Stats are the individual sets of data which are used to build reports.
When building reports, we have introduced a new stat builder and browser that is both faster and easier to use than before.

Stats now have labels, so you can find the specific stats you’d like to include in a report with ease and speed.
Variable Builder
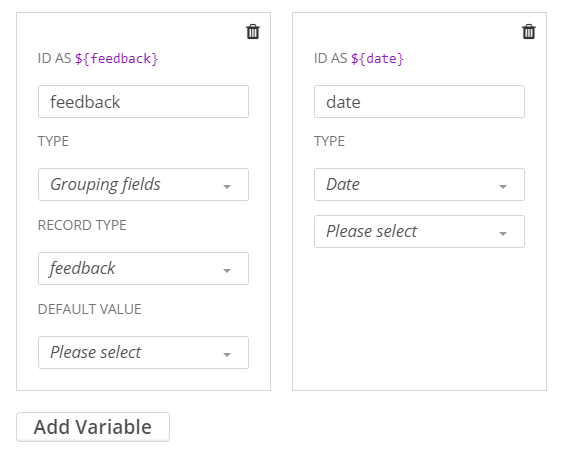
We have also introduced a Variable Builder, which makes it easier to add variables when building queries for reports.

Scheduled Reports
You can now schedule reports to automatically run and distribute results via email.
The email will contain a permalink URL that can be viewed and opened by anyone with access to this URL.
For example, you can schedule a report that outlines helpdesk activity over the previous week to run every Friday at 4pm, and automatically share it with selected colleagues.
New Chart Types
There are three new chart types available in addition to the existing area, line, bar and pie chart types. These are:
- Simple Stat
- Gauge
- Bubble
Custom Javascript
When adding widgets to create reports, you're now able to insert any arbitrary JS code.

Widget Options Override
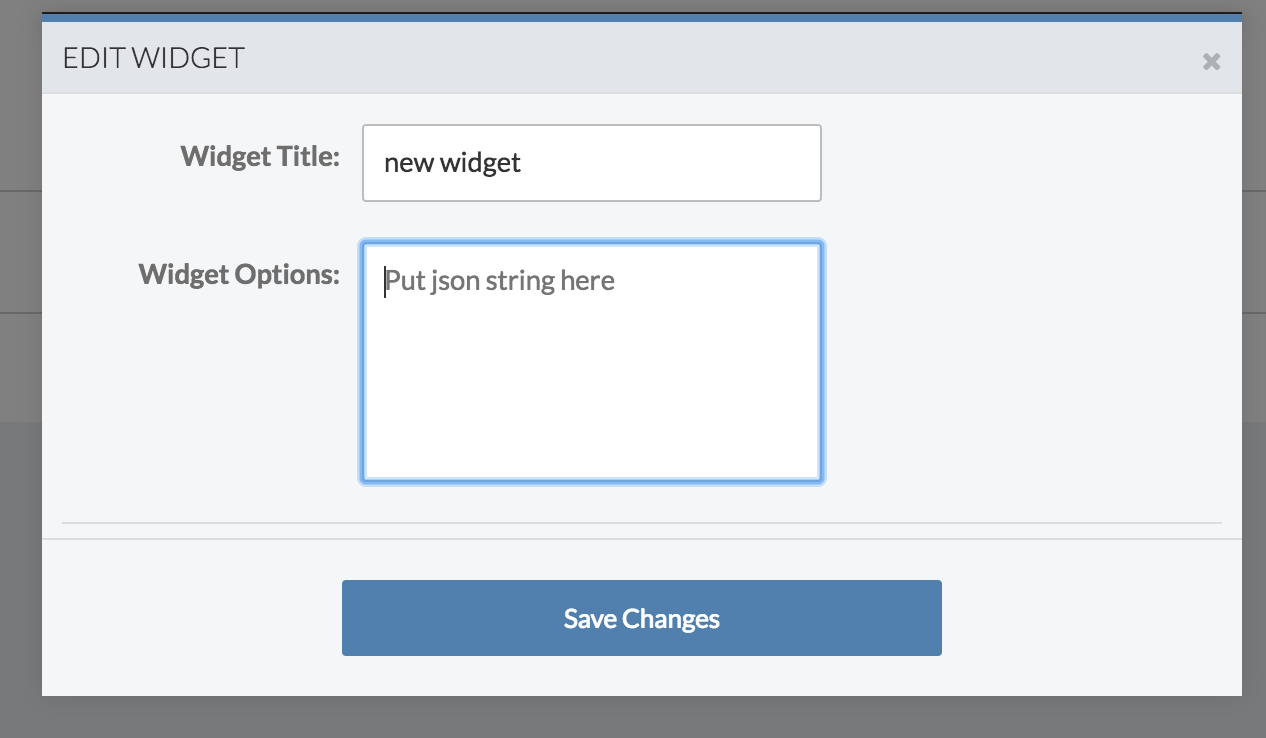
After you've added a widget to a report, you can edit it to set widget overrides.

That "JSON string" is JSON that you can use to override any default chart settings. For example, a common thing might be to disable legends on widgets to save space on reports, or to use prefixes (100000 shown as 100k).
What will happen to old Reports?
Old reports will still be available until 31st August. After then, old Reports will become unavailable, and new Reports will become the standard and only reporting interface within Deskpro. This should give you enough time to make any necessary changes to start using new Reports.
Any existing reports and settings you have in your current helpdesk will be migrated to new reports automatically, but any reports you create in the old reporting system hereafter will not be automatically migrated to new reports.
You will be able to access new Reports from your agent interface. You will need to enable it from your Admin Dashboard, after which it will appear directly underneath old Reports in the interface.

Thanks for reading
If you are using Deskpro Cloud, we will roll out this update to your helpdesk soon.
If you are using Deskpro On-Premise, you can update your helpdesk to the latest version from your Admin Interface.
For more information on product updates associated with this one, take a look at other updates and changes included in the release of Deskpro 2018.1.

