


As part of product release Deskpro 2018.1, we've introduced a whole new reporting system. You can learn more about all that here.
This also means you can expect some changes and improvements to the way DPQL works in reports, and this article has been written to simply explain each of those changes.
All DPQL functions start with DPQL_ prefix
To make it easy to determine which functions are DPQL-specific and which are part of standard MySQL functions, DPQL functions now have to include the prefix 'DPQL_' -e.g. DPQL_COUNT
This now means that functions without the prefix operate just as they would when using standard MySQL.
Support for subqueries
You can now nest a query inside a larger query. For example:
SELECT tickets.id
FROM tickets
WHERE tickets.id IN (
SELECT tickets.id
FROM tickets
WHERE tickets.ref LIKE 'AAAA-%'
)
Support for unions
You can now combine the results of two queries into a single query. For example:
SELECT tickets.id FROM (
(SELECT tickets.id FROM tickets)
UNION
(SELECT tickets.id FROM tickets)
) as t1
No more DISPLAY line
Previously, in DPQL1, a query would start with ‘DISPLAY TABLE’ or the type of report you had selected to display. This is no longer a feature. Admins now simply choose the type of graph as an option rather the it being coded into the query itself.
New function ‘DPQL_JSON_EXTRACT’
This function operates in a similar way to MySQL's [JSON_EXTRACT]. It lets you SELECT a field in the database that is stored as JSON, and extract a specific value for display.
This function only works in the SELECT clause (i.e. a value you want to display) because the decoding only happens in PHP. It can be used to support displaying specific data from a JSON blob.
New function 'DPQL_HIERARCHY'
Deskpro has a number of fields that have hierarchies such as Departments, Organizations, Categories, Products and Custom choice fields. You can use DPQL_HIERARCHY denote hierarchy in reports. This allows you to see a total count for one field and all sub-fields. The below image demonstrates a few real life examples of what the reporting will allow.
- DPQL_HIERARCHY can only be used in a GROUP BY.
- DPQL_HIERARCHY can only be used in the first group by. A currently limitation. You can't use it as a secondary group by param.
The signature for DPQL_HIERARCHY is:
DPQL_HIERARCHY(field, minDepth, maxDepth)- The field can be any field in deskpro where hierarchy exists (custom fields, departments, orgs, etc).
- minDepth is the minimum depth to show
- A minDepth of 1 means we'll show
Ain A>B>C. A minDepth of 2 means we'll showA>BinA>B>C
- A minDepth of 1 means we'll show
- maxDepth is how many levels to show.
- If
minDepthis 1 andmaxDepthis one, thenA>B=10andA>C=5would get rolled up intoA=15(i.e. we collapse the hierarchy into 1 level). - If
minDepthis2andmaxDepthis2, then we'd showA>BandA>Cas separate things. If there wasA>C>Xthen the 'x' value would get rolled-up into the 'c' value. etc.
- If
SELECT DPQL_COUNT() AS 'Number of Hotdogs'
FROM tickets
WHERE tickets.organization <> NULL AND tickets.custom_data[24] <> NULL
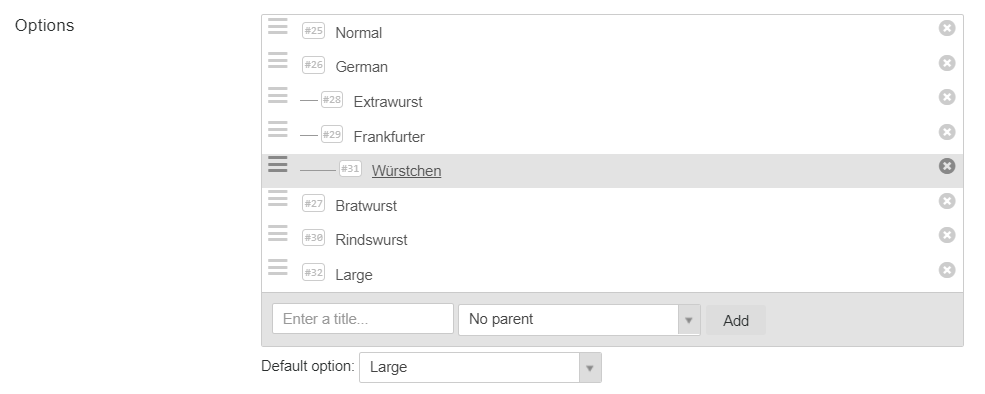
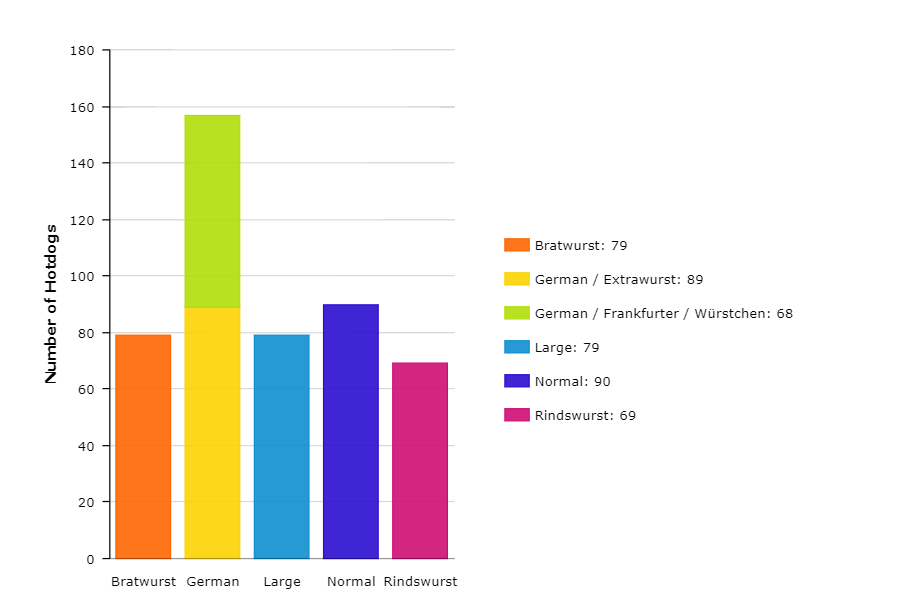
GROUP BY DPQL_HIERARCHY(tickets.custom_data[24], 1, 3) AS 'Type'
This example uses a custom field. See how the field has German > Frankfurter > Wurstchen, but on the report we're limiting it to the top-level hotdog type.
New function: DPQL_HIERARCHY_DESCENDS_FROM
- DPQL_HIERARCHY_DESCENDS_FROM can only be used in a WHERE clause
- DPQL_HIERARCHY_DESCENDS_FROM limits what you want to see in a hierarchy. e.g. if you had
A>B>C>DandX>Y>Zyou might only want to see values underA - For example,
DPQL_HIERARCHY_DESCENDS_FROM(ticket.organization, 5)limits the query to tickets with organizations set to 5 or anything below that.
A query could use this to limit all reports to tickets with the values that descend from the selected value.
SELECT DPQL_COUNT() AS 'Open'
FROM tickets WHERE
tickets.status != 'resolved'
AND tickets.organization <> NULL
AND DPQL_HIERARCHY_DESCENDS_FROM(tickets.custom_data[#], ${variable})
GROUP BY tickets.organization.name AS 'Organization'
New Function: LAYER WITH
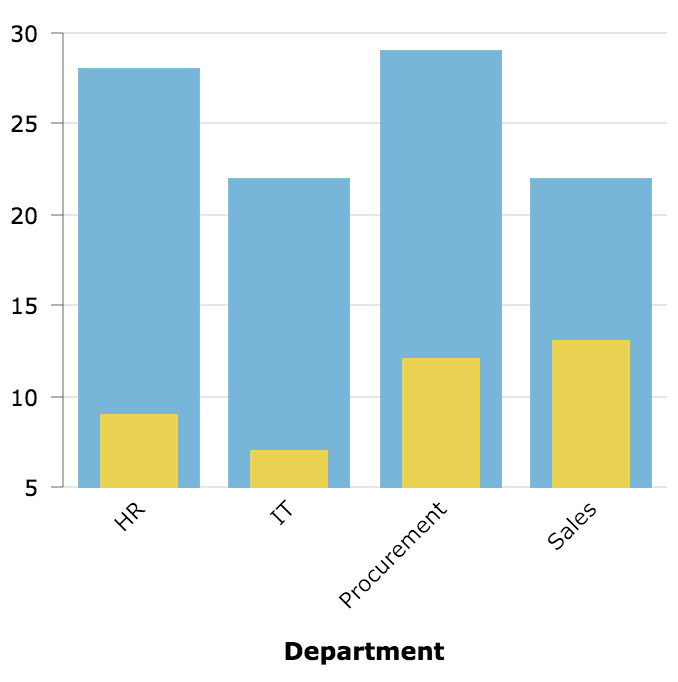
This function allows you to combine multiple result sets in a single query. For example, the results below are generated by the following query.
SELECT
DPQL_COUNT() AS 'Open Tickets',
tickets.organization.name AS 'Department',
'Tickets' AS 'value_axis_title'
FROM tickets
WHERE
tickets.organization.name <> NULL
AND tickets.status IN ('awaiting_user', 'awaiting_agent')
GROUP BY tickets.organization.name AS 'Department'
LAYER WITH
SELECT
DPQL_COUNT() AS 'Closed Tickets',
tickets.organization.name AS 'Department'
FROM tickets
WHERE
tickets.organization.name <> NULL
AND tickets.status = 'resolved'
GROUP BY tickets.organization.name AS 'Department'
You can use LAYER WITH <BAR|LINE> to override the type of the layered graph. E.g. if the main graph is set to show a BAR, you could layer on a LINE graph by using LAYER WITH LINE
If you just use LAYER WITH then the secondary graph will be displayed in the same chart type as the primary.
Changes to: DPQL_FORMAT
FORMAT now acts like it would when using MySQL, and old behaviour is achieved using DPQL_FORMAT.
Signature: DPQL_FORMAT(value, formatType[, otherArgs]...)
DPQL_FORMAT(value, 'number', 2)→ formats a value as a number. The third param is the number of decimal places to show. e.g.123000.4567→123,000.46DPQL_FORMAT(value, 'date', 'F')→ formats the value as a date. The third param is the date format. e.g.2018-05-14→MayDPQL_FORMAT(value, 'percent', 1)→ formats a fractional number as an integer percentage. The third param is the number of decimals to show (if not provided, defaults to 2). e.g.0.755→75.5%
Changes to: DPQL_CONCAT
We have a new DPQL_CONCAT that works just like MySQL CONCAT, except that it functions within Deskpro rather than the database.
This is because some values are raw values from the database, and some values are values that Deskpro needs to render.
CONCAT is a mysql function — it works on raw values from the db. DPQL_CONCAT is a deskpro function, it works on values we get out of the database.
SELECT CONCAT('£', DPQL_FORMAT(value, 'number', 2))
This does NOT work because MySQL cannot concat DPQL_FORMAT — that value does not exist until Deskpro gets involved because DPQL_FORMAT is Deskpro function.
But you could do it this way:
SELECT DPQL_CONCAT('£', DPQL_FORMAT(value, 'number', 2))
Because Deskpro is generating the value in both cases.
It's important to understand the MySQL step is separate from the Deskpro step. MySQL can't determine extra information that gets added in the Deskpro step, because MySQL processes occur before Deskpro processes.
Custom field aliases
It's now possible to give a human "alias" to a custom field. In most places where you would need to refer to a field ID (including reports and our API), you can now use an alias instead.
So tickets.custom_data[123] can now be tickets.custom_data[alias_name]
SELECT AVG(tickets.custom_data[deal_value].value) AS 'Deal Value'
FROM tickets
WHERE
tickets.agent <> NULL
AND tickets.custom_data[deal_value].value <> NULL
AND tickets.custom_data[deal_value].value > 0
GROUP BY tickets.agent AS 'Lawyer'
In order to use custom aliases, remember to determine them in the admin interface before using them in reports.
Using the new 'simple stat' with DPQL
The new 'simple stat' widget type is useful for displaying simple performance data on dashboards.
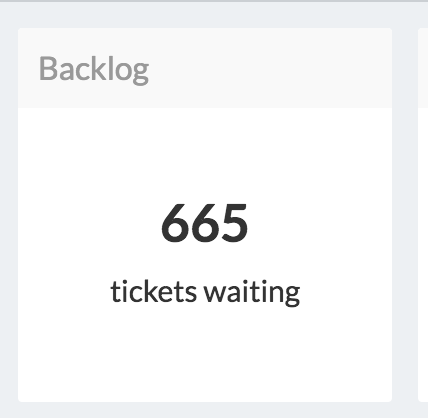
A simple way to use this stat to show tickets created this month through a DPQL query is:
SELECT DPQL_COUNT() as 'stat_value', 'created this month' as 'stat_description'
FROM tickets
WHERE tickets.date_created = %THIS_MONTH%
There are a number of data and variations you can select to display:
stat_value— determines the large value shownstat_description— determines the sub-lineunit_leftandunit_rightare strings that go before/after the value. For example, if you want to show aSUMorAVGvalue of a currency field, you can set the left unit to£. Or if the number you calculated is a percentage, you could set the right unit to%.default_valueis what to show ifstat_valuereturns null. For example, in the above example, if no tickets were created this month, then the count is null, and the report would show "No data". Sometimes it's more useful to just show0instead of "No Data". So you could use... '0' as 'default_value'to force 0 as the default value.
Gauge type
The new 'gauge' widget type is useful for displaying information where you want to see the current value of a statistic against a range of possible values for the same statistic at any given time.
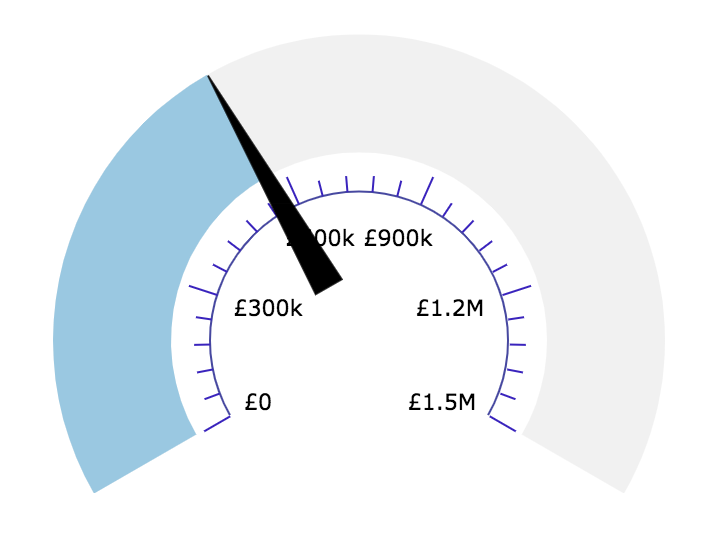
A simple way to use this stat to show the £ value of accumulated ticket charges this year through a DPQL query is:
SELECT SUM(ticket_charges.amount) AS 'stat_value', 1000000 AS 'stat_total', DPQL_CONCAT('£', DPQL_FORMAT(SUM(ticket_charges.amount), 'number', 0), ' of £', DPQL_FORMAT(1000000, 'number', 0), ' budget') AS 'tooltip_text'
FROM ticket_charges
WHERE ticket_charges.ticket.date_created = %THIS_YEAR%
There are a number of data and variations you can select to display:
stat_valuedetermines the value, where to "fill to" or where the needle pointsstat_totaldetermines the total value, displayed as the maximum value at the end of the gaugeunit_leftandunit_rightare strings that go before/after the values. For example, if you want to show aSUMorAVGvalue of a currency field, you can set the left unit to£. Or if the number you calculated is a percentage, you could set the right unit to%.tooltip_textis what to show when you hover your mouse over the gauge
Overriding labels & Tooltips
You can now select extra values in the query to override labels shown on axes, or what appears in 'tooltip' text.
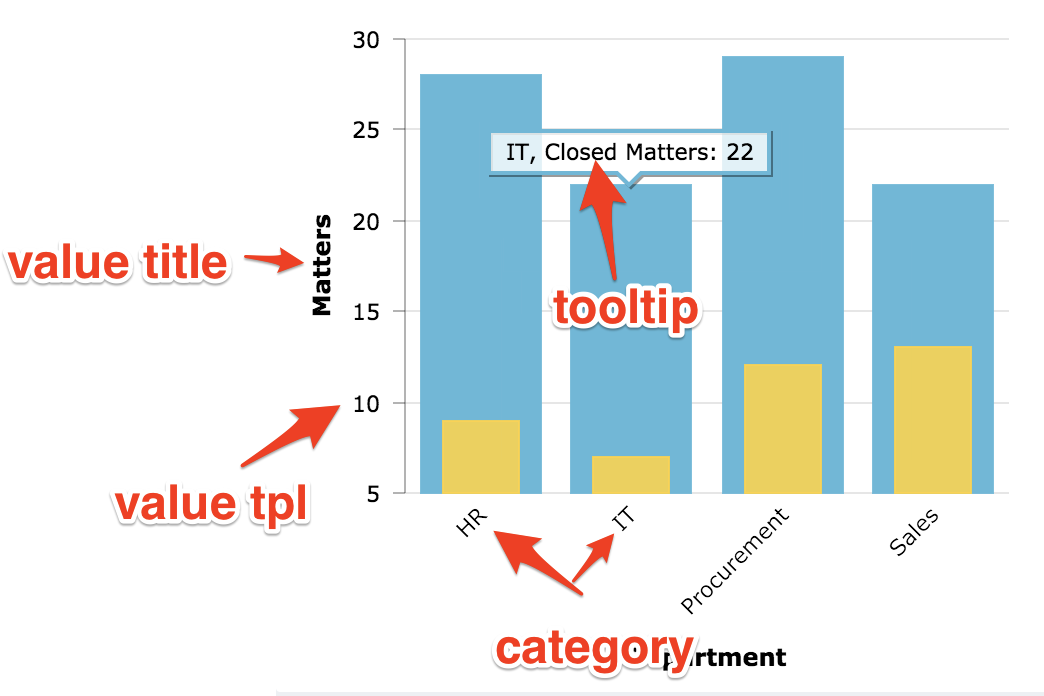
In the SELECT clause, you can use the following to create labels and tooltips:
tooltip_textdetermines the tooltip text. Within the string you can use[[category]]as a placeholder for the category (which is the x axis variable) and[[value]]as the value (which is the value shown on the y axis- usually a count or sum etc).tooltip_text_templatedetermines the tooltip text based on a template that we evaluate client-side. See below for more on templates.value_axis_titledetermines the title shown on . Usually this will be whatever you select the value as, but you can override it here. e.g.SELECT DPQL_COUNT() AS 'example'will by default set the title on the y axis to 'example'. Usevalue_axis_titleto override this and name it accordingly.value_label_templatesets the template for rendering values along the y axiscategory_label_templatesets the template for rendering the categories along the x axis.
Templates
Templates are a way of making it easier to render values in different ways vs the "raw" value in DPQL. Essentially, a template is a string that gets rendered through a simple template engine.
Templates apply only to bar and line charts. Here's an example setting the tooltip text using a template:
SELECT SUM(ticket_charges.amount) as 'Invoiced Costs', 'Cost' AS 'value_axis_title', 'Invoiced: {{formatCurrency value "GBP"}}' as 'tooltip_text_template'
FROM ticket_charges
WHERE ticket_charges.ticket.organization <> NULL AND ticket_charges.ticket.date_created = %THIS_YEAR% AND ticket_charges.ticket.status IN ('resolved', 'closed') GROUP BY ticket_charges.ticket.organization AS 'Organization'
In the template string, {{anything in here}} is special:
- It can be a bare variable, which include
{{value}}and{{category}} - Or it can be a function:
formatCurrencyformats the value as a currency value. The first parameter used should be the value to format, and the second is the specific currency to format. For example, if we wanted to show£123.33we'd use:{{formatCurrency 123.33 "GBP"}}
formatNumberformats a number in ways according to toLocaleString. This would is most likely used in advanced use-cases. The first parameter used should be the value, and the rest can be found in this document. For example{{formatNumber value maximumFractionDigits=1}}would turn a value like1into1.0or a value of223.34874into223.3etc
formatPercentrounds a number to an integer and adds a%{{formatPercent 5.5}}— would render as6%etc.
mathcarries out simple math. The first param is the value, then comes the operator, then comes the right operator.{{math 100 "/" 5}}→100would render as20.
You can also combine functions together with parenthesis. Here's an example combining formatNumber with math:
SELECT AVG(tickets.custom_data[rate_responsiveness])*5 AS 'Responsiveness', 'Responsiveness: {{formatNumber (math value "/" 5) minimumFractionDigits=0 maximumFractionDigits=1}} out of 5' as 'tooltip_text_template'
FROM tickets
WHERE tickets.custom_data[rate_responsiveness].value <> NULL AND tickets.custom_data[external_lawyer] <> NULL GROUP BY DPQL_HIERARCHY(tickets.custom_data[external_lawyer], 1) AS 'Firm'
If you use a template with LAYER WITH, then {{value}} and {{category}} correspond to the first initial graph. {{0_value}} and {{0_category}} refers to the second graph; and the number increments for each layer you add. So referring to the first graph would use value/category; the next layered one would be 0_value/0_category, the one after that is 1_value/1_category, etc
You'd want to define a separate template in each LAYER WITH query to set their own tooltip or else they'd all use the same one.
Here's an example of a template with four layers:
https://gist.github.com/chroder/70bde2256fe3d86fb6ca8141d62319da
Thanks for reading
If you are using Deskpro Cloud, we will roll out this update to your helpdesk soon.
If you are using Deskpro On-Premise, you can update your helpdesk to the latest version from your Admin Interface.
For more information on product updates associated with this one, take a look at other updates and changes included in the release of Deskpro 2018.1.